Marginal Cost of Funds
last updated on Thursday, July 30, 2020 in Advances
Whether creating a new account type for a niche market or simply responding in lockstep with your competitors' rate increases, it's important to understand your marginal cost of funds to avoid overpaying for deposits through cannibalization of your existing accounts or overpaying for deposits that you were never in danger of losing! To do so, you need a quantitative framework for evaluating the relative attractiveness of your various funding options.
The Federal Home Loan Bank of Des Moines has developed a tool that can help assess the true marginal cost of funds. The Marginal Cost of Funds Tool is designed to help you quantify the marginal cost of deposit growth and/or retention strategies compared to the use of advances. What the following examples demonstrate is the true marginal cost of raising new or retaining existing deposits and the related difficultly and unexpected results that may arise.
Raise New Deposits
Offer a promotional rate of 0.65% on a one-year certificate of deposit (CD) in an effort to raise $5 million.
To assess the marginal cost of this strategy, you have to estimate the value of four variables:
- Promotional Rate: The rate you are going to pay on the new promotional account
- Cannibalization Rate: The proportion of existing accounts that will transfer to the new promotional account
- Current Rate on Repriced Accounts: The weighted average rate on existing accounts that will transfer to the new promotional account (reflects the cannibalization that occurs)
- FHLB Des Moines Advance Rate: The rate on an advance of similar tenor to the new promotional account
Of the four variables, the cannibalization rate and the current rate on repriced accounts are the most difficult to estimate and can have a significant impact on the results of the analysis. Let's take a look at those variables a little more closely.
Cannibalization Rate and Current Rate on Repriced Accounts
Let's assume that when you launch the new promotional CD that, in addition to attracting new funds, 4.5% of your existing depositors will transfer their funds to the new account in order to take advantage of the higher rate.
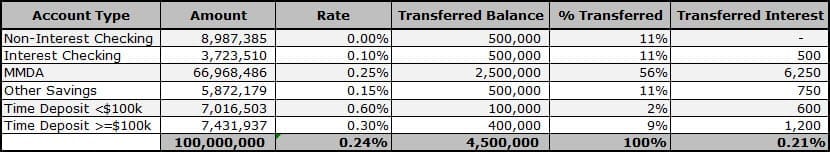
Table 1 illustrates the existing deposit profile of a typical institution, the relative proportion of each deposit type expected to transfer to the new account, and the current rate on each account. In this example, 0.21% represents the weighted average rate of all existing deposit accounts that are expected to transfer to the promotional account. In other words, $4.5 million of existing deposits with a weighted average rate of 0.21% are expected to reprice.
Table 1. Hypothetical Existing Deposit Base and Relative Proportions of Transferred Deposits
Cost to You Assuming a 4.5% cannibalization rate and 0.21% rate on repriced accounts, Table 2 shows the marginal cost of attracting $5 million in new one-year deposits with a promotional rate of 0.65%, exposing the hidden costs of this strategy.
Table 2. Marginal Cost of Promotional Strategy
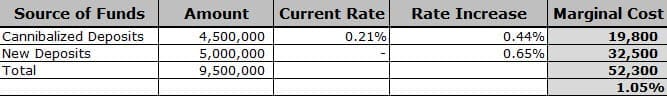
Under these assumptions, the true cost of raising $5 million in new deposits is actually $52,300 or 1.05%. Mathematically, this is the increase in total cost ($52,300) divided by the change in new deposits ($5 million). Assuming the marginal cost of a one-year Bank advance is less than the cost of growing your deposits, a call to the Money Desk may be in order!
Contact your relationship manager to find out how you can access our Marginal Cost of Funds Analytics and analyze a variety of scenarios tailored for your unique circumstances.
Replace Funds that are Lost to Other Sources of Funding
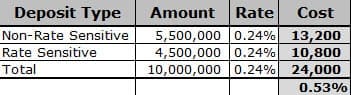
Let's consider an environment where deposits are more transient and the focus is on maintaining existing funding levels versus growing deposits. Perhaps your competitors are increasing rates on one-year CDs and you need to evaluate whether or not to respond in lockstep. In this type of analysis, you need to estimate the percentage of your institution's maturing one-year time deposit accounts that will move to the competition unless you match the competition's rate. This percentage is defined as the rate sensitive portion of that segment of the deposit base. Table 3 shows the rate sensitive and non-rate sensitive portions of the maturing one-year CD accounts for our hypothetical institution. Here we assume that 45% of the account holders are rate sensitive.
Table 3. Rate-Sensitive and Non-Rate Sensitive Portions of Maturing One-Year CD Accounts
Option 1: “pay-up” or increase rates in order to retain the maturing deposits.
Table 4 shows the marginal cost of the strategy.
Table 4. Marginal Cost of Increasing Rates to Retain Deposits 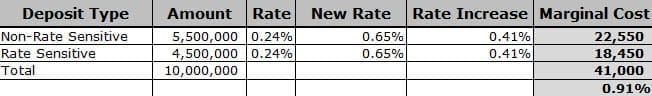
Option 2: “Stand pat” and let the “hot” money go.
Table 5 shows the marginal cost of holding rates constant and replacing the runoff with a one-year Bank advance at a rate of 1.02%.
Table 5. Marginal Cost of Holding Rates Constant and Replacing Runoff with an FHLB Des Moines Advance
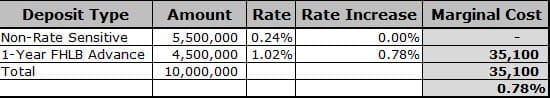
Here we can see that, given the assumed parameters, a substantial savings can be realized by allowing the rate sensitive deposits to runoff and replacing them with on-demand funding from the Federal Home Loan Bank of Des Moines.
Option 1 Marginal Cost: 0.91%
Option 2 Marginal Cost: 0.78%
Whether you want to grow your deposits or retain your existing balances, the marginal cost of the strategies used in accomplishing your objectives should be considered. As we have seen, when the hidden and not-so-hidden marginal costs are considered, tapping your Bank's reliable wholesale funding may be the cheapest alternative.
Contact your relationship manager to find out how you can access our Marginal Cost of Funds Analytics and analyze a variety of scenarios tailored for your unique circumstances. Or, call the FHLB Des Moines Strategies Team.
TAGS
- Funding
- Marginal Cost of Funds
- Solutions
- Strategies