Positioning Your Balance Sheet During Half-Time
last updated on Monday, July 24, 2023 in Advances
It’s July 2023. Half-time. All-Star Break. Solstice. A time to reflect on where your balance sheet is positioned during a time of unprecedent uncertainty over the pricing and duration of deposits and yield curve volatility. It’s now a good time to contemplate the current funding environment and examine various strategies that can help mitigate the next few quarters of potentially compressed net interest margin and liquidity availability.
Break-Even Analysis of the Yield Curve: An Indicator for Balance Sheet Positioning and a Case for Term Funding
A yield curve optimal points analysis can measure changes in the slope of the yield curve and the "roll-down" benefit of various advance maturities. It's often useful to evaluate the market's forward view of interest rates (much like a "point spread" to project uncertain outcomes) and assess the optimal points on the yield curve upon which to invest or fund your balance sheet.
Thus far in 2023, the yield curve has continued to invert. From January 3, 2023, to June 30, 2023, the negative spread between one- to ten-year advances has increased from -43 basis points to -111 basis points. Clearly, a steady stream of fed funds rate hikes and the telegraphing of further tightening have contributed to changes in the yield curve slope. Moreover, many depositories are seeing shifts in their interest rate risk positions in the direction of liability sensitivity. This shift has been caused by rising deposit betas, resulting in shortened assumed deposit durations while rates rise and deposit price competition intensifies. As a result, in addition to a desire to take advantage of inversions in the yield curve, many institutions are funding their balance sheets with: a) term advances, or b) shorter-term advances (e.g. one- or three-month maturities) with an overlaying fixed-rate interest rate swap.
It's always useful to look closely at the yield curve for clues about both historical and relative value. Consider the data provided in Figure 1 (representing the yield curve based on FHLB Des Moines non-dividend-adjusted term advances as of January 3, 2023) and Figure 2 (representing the yield curve based on FHLB Des Moines term advances as of June 30, 2023). Derivation of the Break-Even Rate Rise metric follows are further explained in the Technical Note* below.
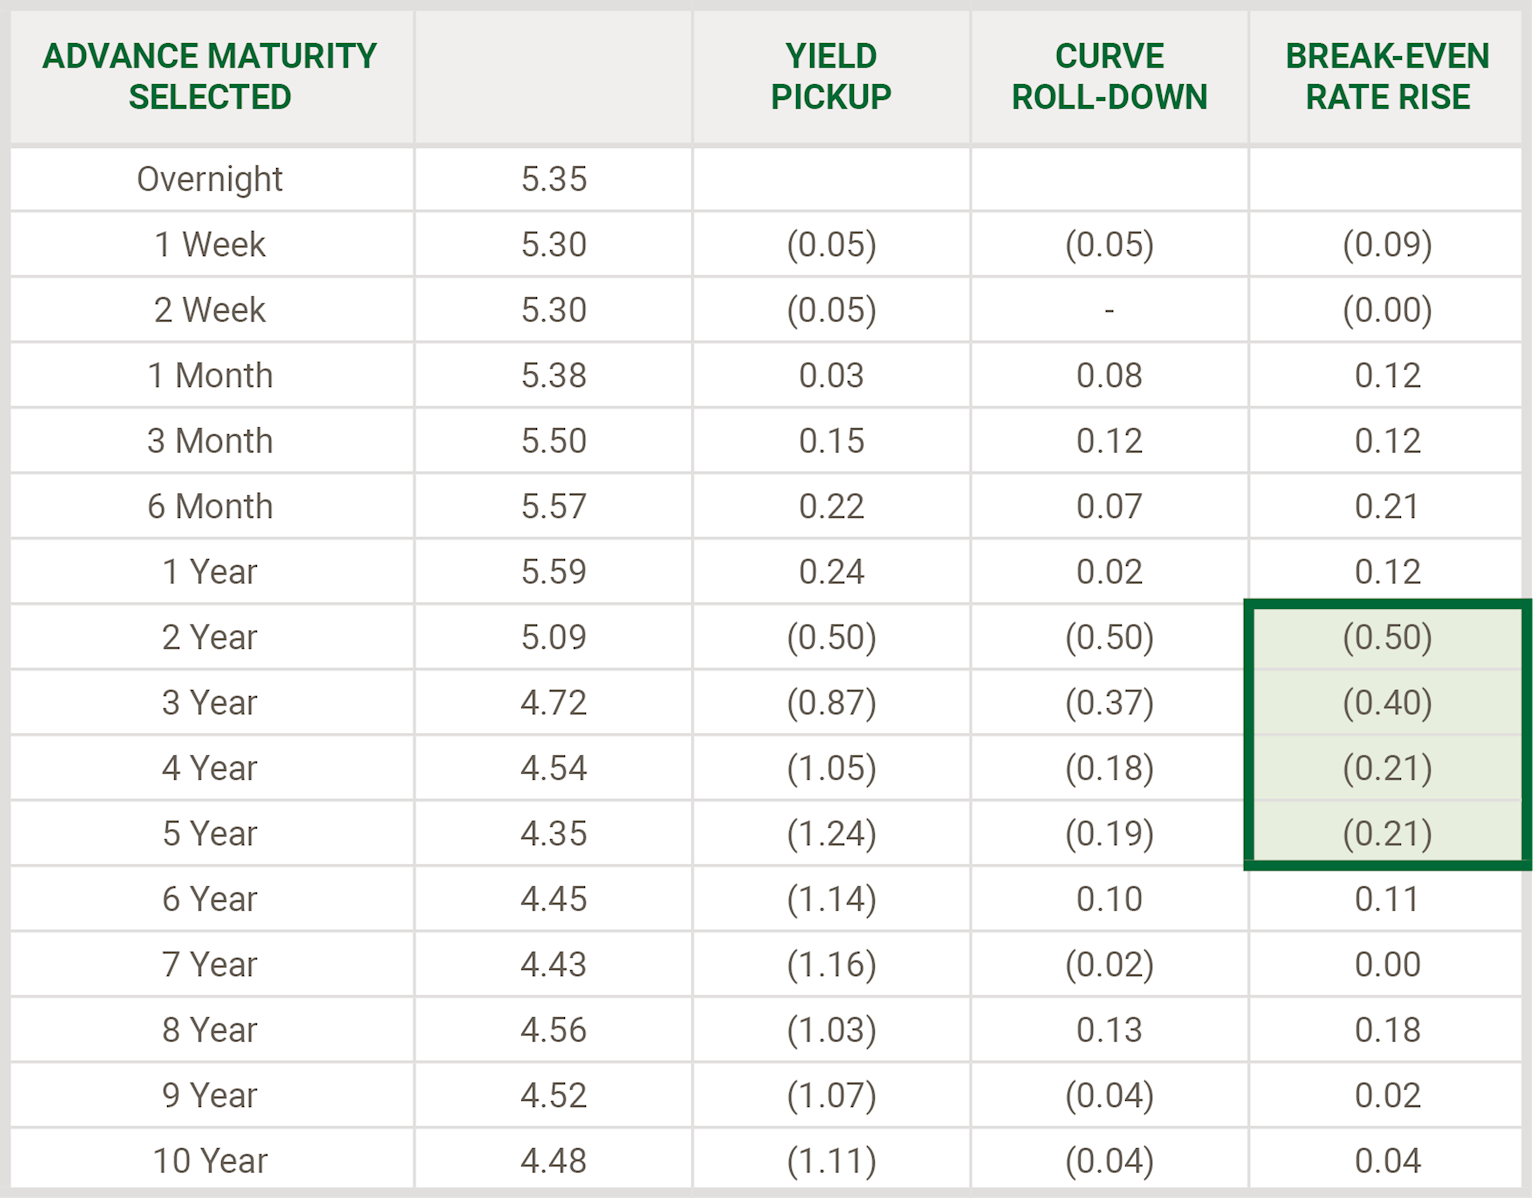
As of June 30, 2023, there were negative 50 basis points of protection (versus negative 33 basis points of protection as of January 3, 2023) from rising rates for an investor who opts to purchase a two-year security and sell it by the end of the first year. From a borrower’s standpoint, the break-even incentive is the inverse of an investor’s. All other factors aside, rates would need to rise by more than 0.50 percent for a two-year borrowing not to make sense relative to a one-year borrowing.
Figure 1 - FHLB Des Moines Yield Curve - Optimal Points Analysis (January 3, 2023)
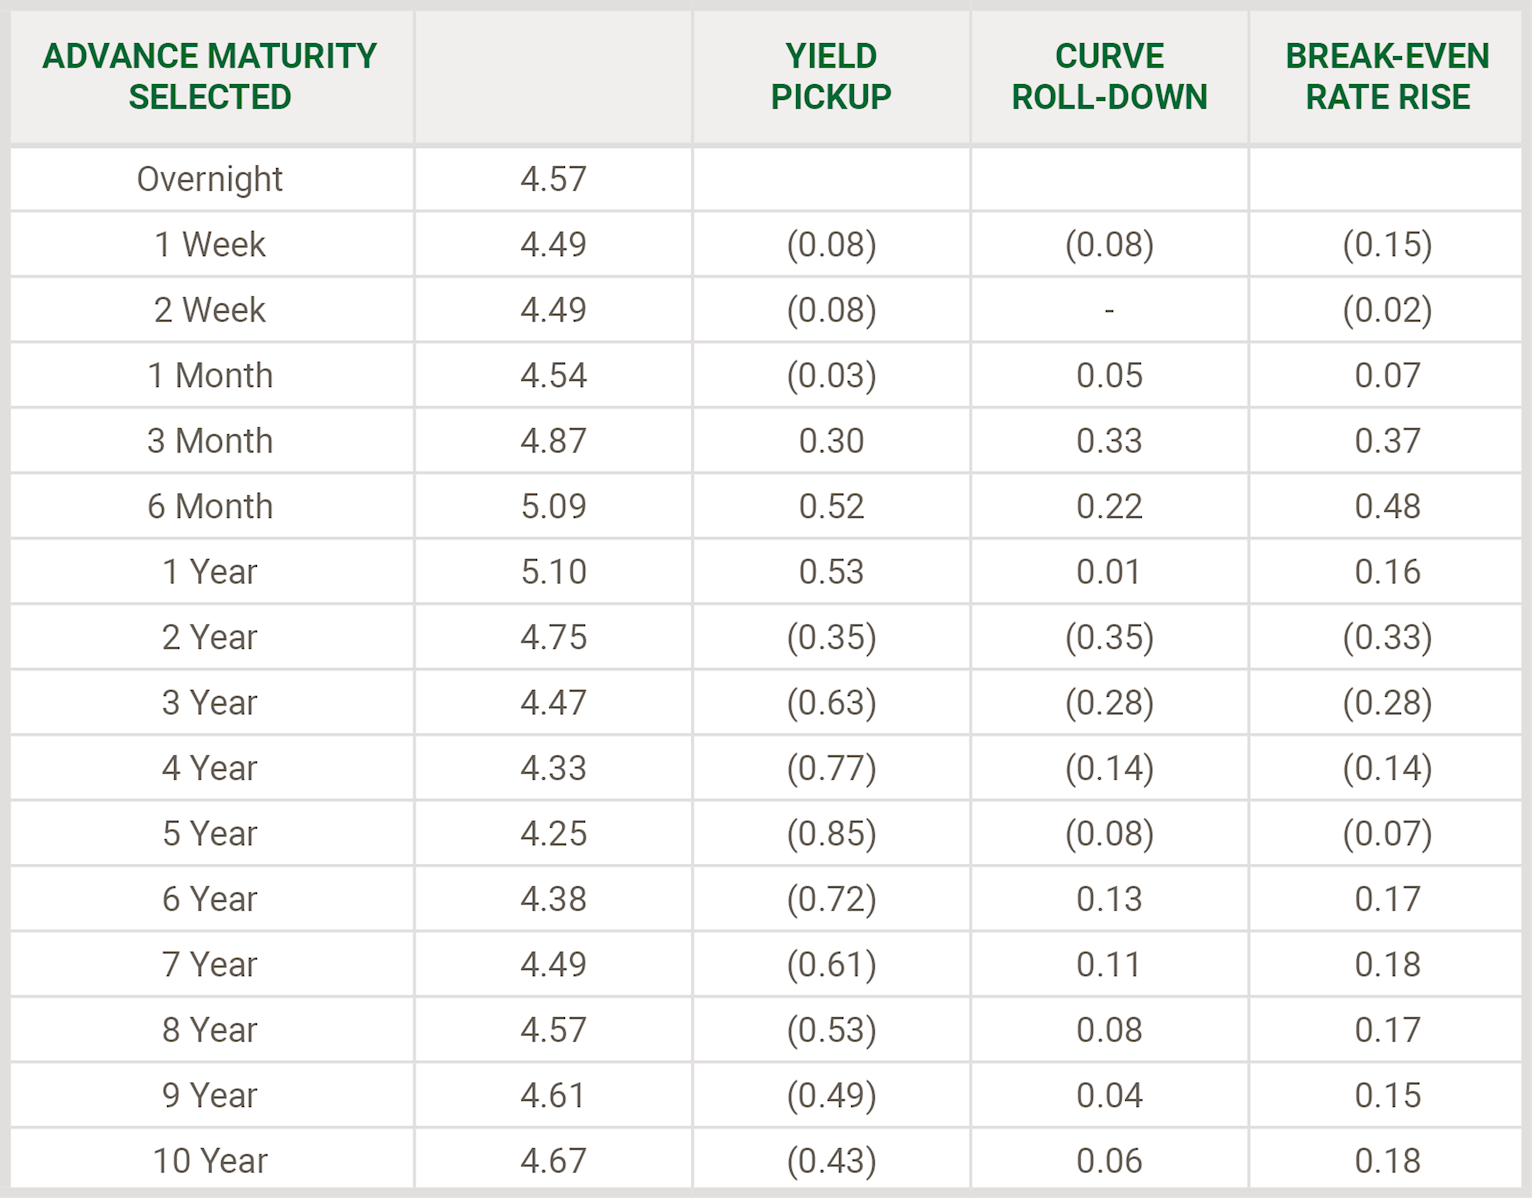
Figure 2 - FHLB Des Moines Yield Curve - Optimal Points Analysis (June 30, 2023)
Observations on Today’s Yield Curve:
We can generally observe "break-even" points on the yield curve to gauge the market's view of the most optimal place to invest, or, inversely, to fund a balance sheet. In the example presented, one might conclude the following about today's yield curve:
- In historical terms, today's yield curve suggests that in relative terms, there may be merits to the use of funding in two-, three- or five-year maturities, versus shorter maturities. As an example, the current environment may be conducive for executing term funding with "symmetrical prepayment" features. This structure, in the form of term advances, would allow a member institution to prepay and monetize the value of a liability during a time of rising rates.
- The currently inverted/flat yield curve underscores the importance for financial institutions to challenge assumptions within their ALM and liquidity models. Should rates continue to increase, depositors may further seek alternative sources of yield and require that financial institutions pay up to replace any lost deposits. Loan durations could shift as well, should demand accelerate for fixed-rate product. Those low-yield deposits that you counted on to be longer in duration may no longer be available to fund a shift toward new fixed-rate loans. Now may be the time to consider complementing your deposit structure with longer, more duration-certain liabilities. You may also consider restructuring your deposit and product offerings. Here are some guiding questions for discussion in your ALCO’s: Is it time to revisit the withdrawal penalty period provisions for your time deposits? Should you reconsider the mix of your variable-rate loans relative to your fixed-rate loans in order to increase asset sensitivity? Should you invert your retail CD offerings in concert with the actual yield curve? Are you taking the rights steps to develop a marginal cost of funds culture within your institution? FHLB Des Moines can help you with this and would be glad to further discuss with your management team and ALCO. Make it a habit to use a break-even analysis of the yield curve as an occasional review of the point spread. It can often be a good barometer of what an efficient market is telling you about how your balance sheet may be best positioned. FHLB Des Moines has recently made a concerted effort to generate improved levels on all of our term advances. Now is a great time to consider locking in term funding and to add some duration certainty to the right hand-side of your balance sheet.
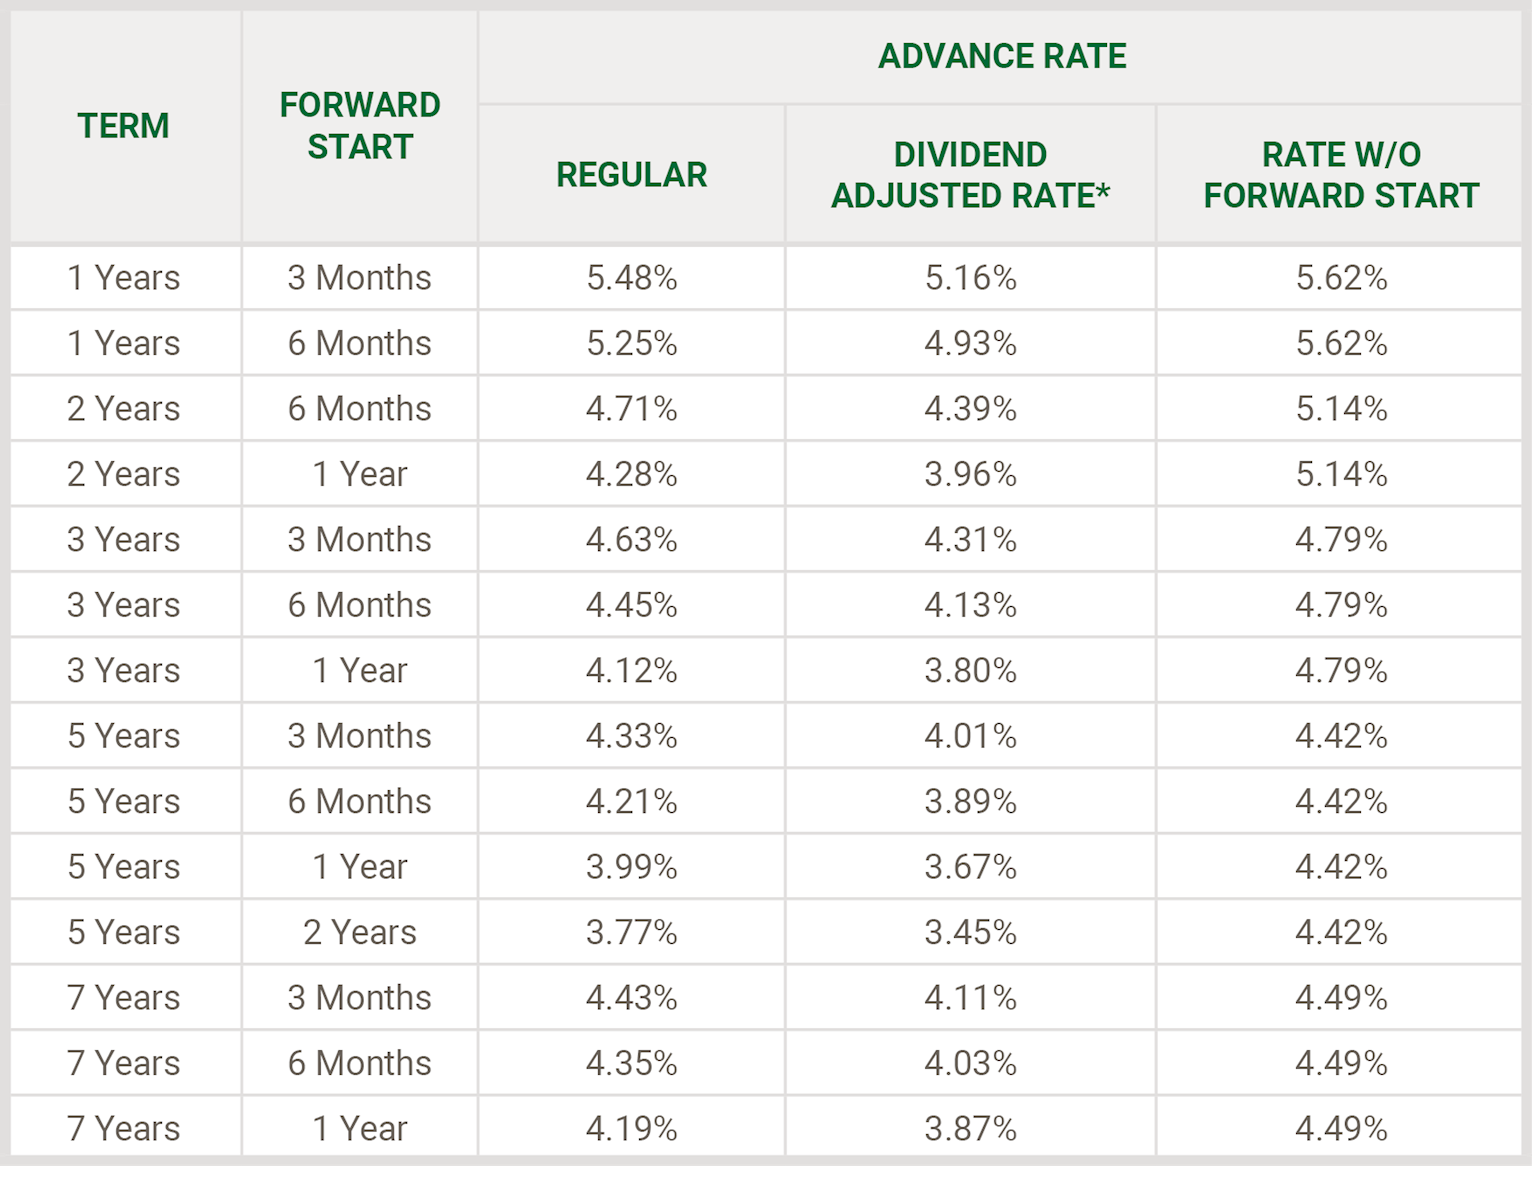
Forward Starting Advance Levels
The yield curve inversion is further highlighted by current levels of Forward Starting Advances. Forward Starting Advance levels, as you might expect from the current environment, are particularly competitive with bullet advances throughout much of the intermediate portion of the yield curve. In most sectors of the yield curve, rates on Forward Starting Advances are below corresponding rate maturities without the forward settlement feature. Should the Federal Reserve Bank Term Facility expire in 2024, you may wish to hedge and pre-fund with Forward Starting Advances.
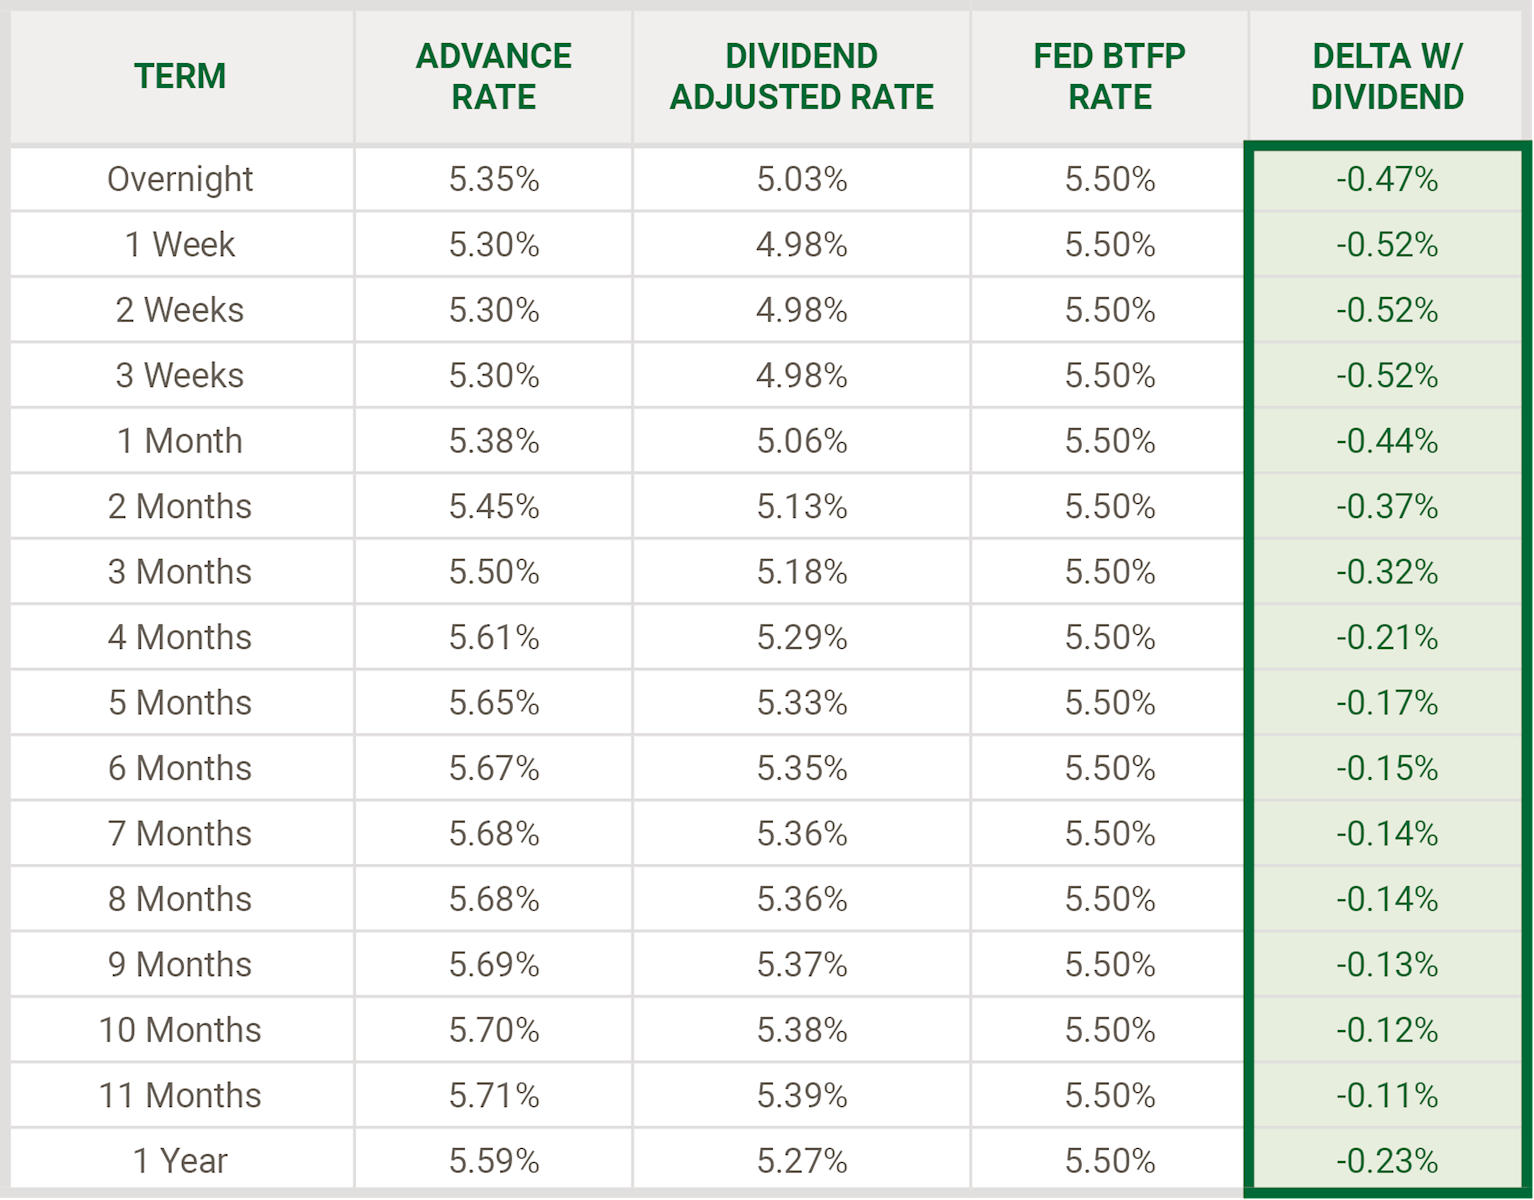
FHLB Advances vs. Federal Reserve Term Bank Facility
Using today’s levels, on a dividend-adjusted basis, FHLB Des Moines advances continue to be competitive with the Bank Term Funding Program (BTFP). The same holds true against brokered CD rates that we monitor throughout the curve.
Figure 4 Comparison of FHLB Des Moines Advance Rates vs Federal Reserve BTFP – June 30, 2023
Additional Strategic Balance Sheet Options
In addition to hedging the risk of rising rates with term advances (not to mention taking advantage of the inverted yield curve and optimal break-even borrowing pick-up in the two-to five-year sector of the forward curve), there are other measures that warrant further action:
-
Establish a public unit deposit letter of credit program to improve your liquidity ratios and unencumber securities. Contact your FHLB Des Moines relationship manager and ask for a pro-forma analysis of how Letters of Credit can bolster your liquidity metrics.
-
Optimize your advance-equivalent collateral position with FHLB Des Moines. Work with and incentivize your loan servicing team to cross-reference your loans with respective eligibility checklists. Loan documentation is increasingly heading in the direction of eNotes. Consult with your relationship manager on how to pledge your residential loans that are documented as eNotes. Also, follow developments with your relationship manager and work with your state trade associates on modifications to the Uniform Commercial Code that would enable further progress in permitting FHLB Des Moines to accept eNote documents on commercial loans as eligible collateral.
- Develop a marginal cost of funds culture throughout your organization Never before has your financial institution faced such intense retail pricing pressure. Deposit pricing mistakes can push your marginal cost of funds well into the double-digits in the current environment. The FHLB Des Moines team would be pleased to present a customized discussion of this timely topic to your ALCO and board.
Final Thoughts:
The past few months have underscored the need for heightened risk management. Most of us were taught long ago that the most effective means of mitigating risk is through diversification. Balance sheet diversification has traditionally been viewed through the lens of diversifying your loans and investments. The same holds true for the right-hand side of the balance sheet. Think of adding duration-certain liabilities to your funding portfolio in the form of competitively-priced FHLB Des Moines term advances as well! Advances are currently your most rate-competitive source of funding, rather than strictly liquidity.
*Technical Note:
- “Yield Pickup” is calculated by subtracting the initial (one-year) advance rate from advance rate of the specified maturity (advance rate year 2 — advance rate year 1, etc.).
- “Curve Roll-Down” is calculated by subtracting the previous year Yield Pickup from the specified year Yield Pickup (yield pickup year 2 — yield pickup year 1, etc.).
- “Break-Even Rate Rise” is calculated by adding: ((Curve Roll-Down) + (Yield Pickup/Maturity in Years — 1 Year) + (.01 + and additional .01 for each year of maturity)).
From an investor's perspective, since the start of the year, there has been a diminished level of "roll-down" benefit, particularly associated with the two- to five-year sector of the yield curve. Phrased another way: An investor might have two alternatives covering a one-year time horizon:
- Purchase a one-year, fixed-income security (assumed to be pegged to the FHLBank advance yield curve) at 5.46 percent, in this example.
- Purchase a two-year security at 4.49 percent, in this example, and sell it after one year.
Implied yield curve analysis asks an investor (or conversely a borrower) “At what point would you be better off purchasing the two-year security and selling it at the end of the first year, versus purchasing the one-year security?” That is, should rates rise, even though some principal loss could be sustained on the longer-duration security, would the extra yield earned, relative to the one-year portion of the yield curve, more than offset the loss?